These Are the Top 30 Nebraska Towns with the Fastest-Growing Home Prices Over the Last 5 Years

An analysis of Nebraska’s residential real estate market from December 2019 to December 2024, based on Zillow Home Value Index data, reveals remarkable patterns of growth across the state’s smaller communities.
Lyons, which achieved the only triple-digit growth rate at 100.4%, far outpaced the second-highest growth rate of 83.5% in De Witt.
Notably, the majority of the fastest-growing towns have populations under 1,000 residents, suggesting a significant shift in home buyer preferences toward smaller, more rural communities.
Additionally, while the growth rates are impressive, the actual home values remain relatively affordable compared to national averages, with even the highest-priced town, Lisco, reaching just $294,455 by 2024. The data also shows a clear geographic pattern, with many of the fastest-growing communities clustered in the eastern third of the state.
These price trends paint a compelling picture of Nebraska’s evolving real estate landscape. The thirty fastest-growing markets showed remarkable consistency in their growth trajectories, with all achieving at least a 63% increase in home values over the five-year period.
Even the “slowest” growing town in this top tier, Fairbury, posted an impressive 63.4% gain, demonstrating the robust nature of Nebraska’s housing market recovery and growth during this period.
This transformation suggests a broader shift in the state’s residential real estate dynamics, possibly driven by factors such as remote work opportunities, lifestyle changes following the pandemic, and the growing appeal of small-town living.
Here’s the list of 30 fastest growing towns in Nebraska based on home price increases over 5 years.
1. Fairbury

Tucked away in southeastern Nebraska, Fairbury has shown steady market growth over the five-year period. Starting with a modest baseline of $70,793 in December 2019, home values climbed to $115,659 by December 2024, representing a 63.4% increase in property values.
2. Scribner

Nestled in the heart of Nebraska, Scribner demonstrates the state’s robust real estate momentum. From a substantial 2019 value point of $134,413, properties in this community appreciated to $219,779 by 2024, marking a solid 63.5% growth in home equity.
3. Hemingford

This western Nebraska gem tells an impressive story of property appreciation. Beginning at $119,812 in late 2019, home values in Hemingford surged to reach $195,912 by the end of 2024, achieving a noteworthy 63.5% increase in market value.
4. Edgar

The real estate journey in Edgar showcases the town’s growing appeal. Property values that started at $81,936 in December 2019 experienced steady appreciation, reaching $134,429 by December 2024, reflecting a robust 64.1% growth in the market.
5. Howells

Market dynamics in Howells paint a picture of strong property appreciation. From an initial value point of $141,994 in 2019, homes in this community climbed to an impressive $233,121 by 2024, marking a significant 64.2% increase in value.
6. Polk

The real estate landscape in Polk demonstrates remarkable resilience. Starting from $96,043 in late 2019, property values made steady gains to reach $157,925 by the end of 2024, recording a healthy 64.4% appreciation in home values.
7. Broadwater

Small but mighty, Broadwater’s housing market shows impressive gains. The town saw property values rise from $71,855 in December 2019 to $118,409 by year-end 2024, representing a substantial 64.8% increase in home equity.
8. Clarkson

Property values in Clarkson tell a story of consistent growth. Beginning at $151,487 in 2019, home values in this community rose steadily to reach $250,178 by 2024, achieving a remarkable 65.1% appreciation over the five-year span.
9. Harrison

The real estate narrative in Harrison reflects strong market fundamentals. From a starting point of $110,871 in late 2019, property values climbed steadily to reach $183,986 by December 2024, posting a solid 65.9% increase in value.
10. Ohiowa

Market momentum in Ohiowa showcases the town’s growing prosperity. Property values started at $126,553 in December 2019 and demonstrated consistent growth, reaching $210,218 by the end of 2024, marking a substantial 66.1% appreciation.
11. Craig

The housing story in Craig reflects robust market health. Starting from $123,705 in late 2019, home values showed steady appreciation to reach $205,946 by December 2024, representing an impressive 66.5% growth in property values.
12. North Loup

Real estate in North Loup demonstrates remarkable vitality. Beginning at a modest $57,496 in 2019, property values surged upward to reach $95,948 by 2024, achieving a significant 66.9% increase in market value.
13. Venango

The property market in Venango shows impressive strength. From an initial value of $81,726 in December 2019, homes in this community appreciated to $136,466 by the end of 2024, posting a strong 67.0% growth in value.
14. Hayes Center

Market performance in Hayes Center reflects sustained momentum. Starting at $128,843 in late 2019, property values demonstrated consistent growth to reach $216,135 by December 2024, marking a notable 67.8% appreciation.
15. Oakland

The real estate transformation in Oakland catches attention. Home values began at $110,484 in December 2019 and showed steady appreciation, climbing to $185,366 by the end of 2024, representing a robust 67.8% increase.
16. Decatur

Property dynamics in Decatur tell a compelling growth story. From a starting point of $79,040 in 2019, home values in this community rose steadily to reach $133,385 by 2024, achieving an impressive 68.8% appreciation.
17. Deshler

The housing market in Deshler demonstrates remarkable resilience. Beginning at $70,461 in late 2019, property values showed consistent growth to reach $119,495 by December 2024, posting a substantial 69.6% increase.
18. Humboldt

Market strength in Humboldt reflects growing community appeal. Starting from $80,221 in December 2019, home values appreciated steadily to reach $136,187 by the end of 2024, marking a significant 69.8% growth in value.
19. Lisco

Lisco’s real estate narrative showcases impressive gains. Property values began at a robust $172,604 in late 2019 and demonstrated strong appreciation, reaching $294,455 by December 2024, representing a noteworthy 70.6% increase.
20. Lemoyne

The housing story in Lemoyne reflects substantial market strength. From an initial value of $157,900 in 2019, homes in this community climbed to $270,476 by 2024, achieving a remarkable 71.3% appreciation.
21. Trenton

Property performance in Trenton shows impressive momentum. Starting at $62,168 in December 2019, home values demonstrated consistent growth to reach $107,163 by the end of 2024, posting a strong 72.4% increase.
22. Harvard

The real estate landscape in Harvard tells a story of remarkable growth. Beginning at $68,390 in late 2019, property values showed steady appreciation to reach $118,849 by December 2024, marking a substantial 73.8% increase.
23. Palisade

Market dynamics in Palisade showcase impressive gains. From a starting point of $68,939 in 2019, home values in this community rose dramatically to reach $120,372 by 2024, achieving a notable 74.6% appreciation.
24. Stratton

The housing market in Stratton demonstrates exceptional strength. Property values began at $81,041 in December 2019 and showed consistent growth, climbing to $141,511 by the end of 2024, representing an impressive 74.6% increase.
25. Davenport

Real estate performance in Davenport reflects robust market health. Starting from $70,765 in late 2019, home values appreciated significantly to reach $123,906 by December 2024, posting a remarkable 75.1% growth.
26. Western

The property story in Western showcases substantial market gains. Beginning at $83,985 in 2019, home values demonstrated strong appreciation to reach $148,157 by 2024, marking a significant 76.4% increase in value.
27. Red Cloud

Market momentum in Red Cloud tells an impressive story. From a modest $52,776 in December 2019, property values surged upward to reach $93,312 by the end of 2024, achieving a substantial 76.8% appreciation.
28. Springview
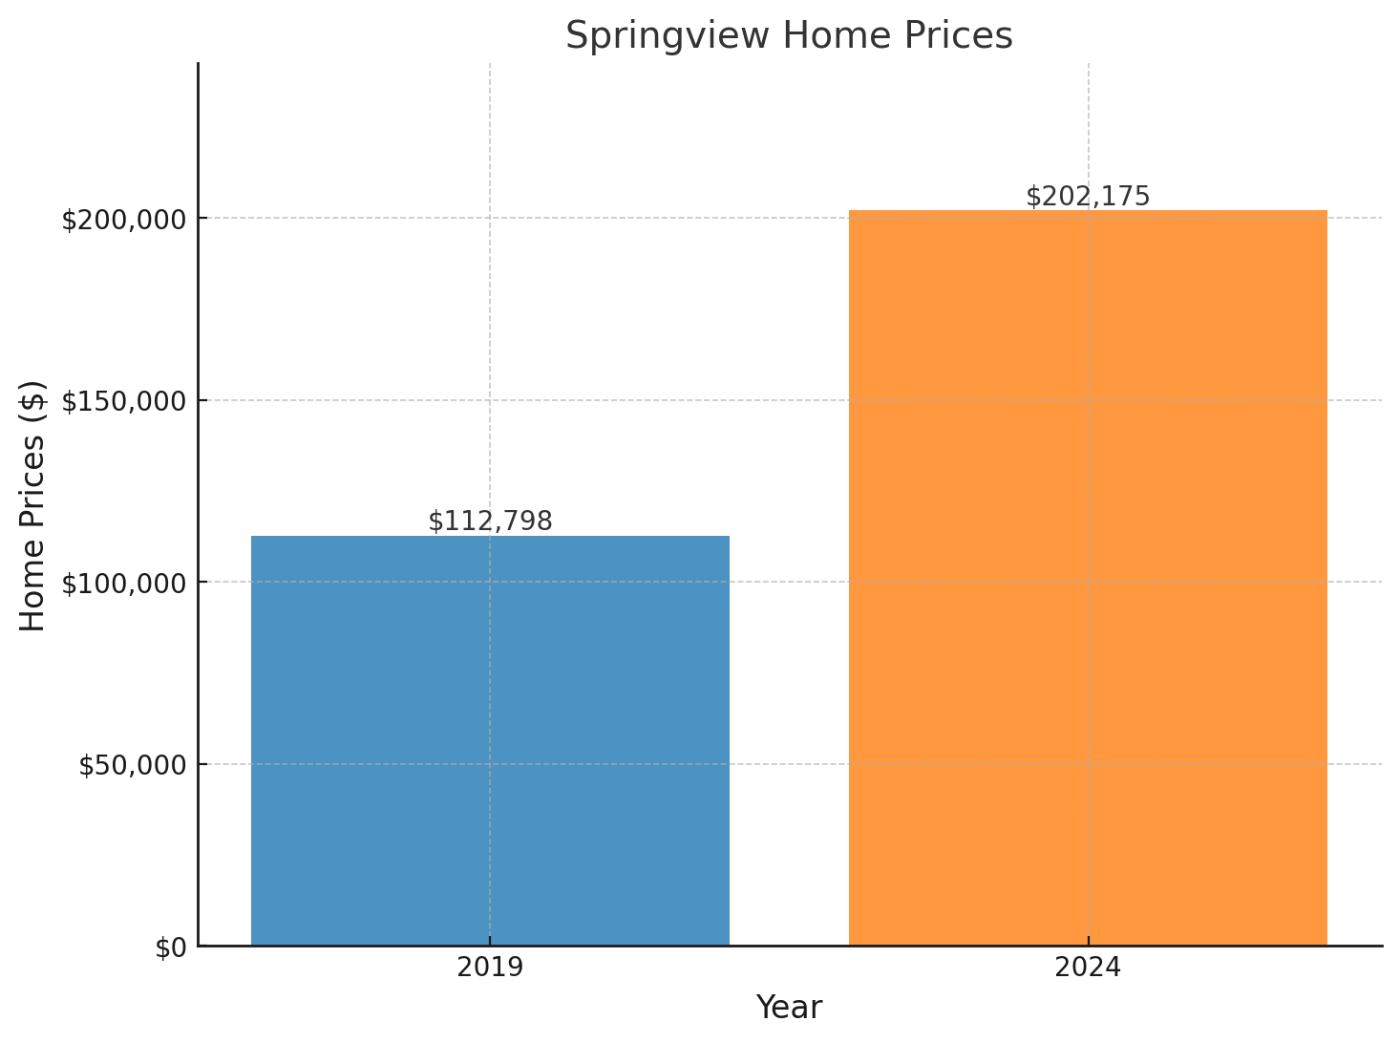
The real estate narrative in Springview reflects extraordinary growth. Starting at $112,798 in late 2019, home values showed remarkable appreciation to reach $202,175 by December 2024, posting an impressive 79.2% increase.
29. De Witt

Property performance in De Witt demonstrates exceptional market strength. Beginning at $105,045 in 2019, home values in this community surged to reach $192,751 by 2024, marking a remarkable 83.5% appreciation.
30. Lyons

Leading the pack, Lyons’ real estate market shows phenomenal growth. From a starting point of $62,537 in December 2019, property values more than doubled to reach $125,320 by the end of 2024, achieving an outstanding 100.4% increase in value.
In case you’re interested in the home values and growth rates of all the other Nebraska towns in the data, here they are (it’s long)
The list goes from lowest to highest percentage growth in home prices.
1. Spencer: +8.5%
– 2019: $125,188
– 2024: $135,797
2. Oxford: +19.0%
– 2019: $101,183
– 2024: $120,443
3. Cambridge: +22.1%
– 2019: $137,822
– 2024: $168,239
4. Broken Bow: +22.7%
– 2019: $125,897
– 2024: $154,434
5. Arnold: +23.3%
– 2019: $118,112
– 2024: $145,645
6. Wallace: +23.4%
– 2019: $83,014
– 2024: $102,406
7. Farnam: +26.0%
– 2019: $134,234
– 2024: $169,191
8. Axtell: +26.4%
– 2019: $204,043
– 2024: $257,967
9. Guide Rock: +26.8%
– 2019: $78,625
– 2024: $99,704
10. Arapahoe: +28.2%
– 2019: $124,335
– 2024: $159,342
11. O’Neill: +28.6%
– 2019: $120,387
– 2024: $154,810
12. Newman Grove: +29.3%
– 2019: $124,352
– 2024: $160,831
13. Holdrege: +30.2%
– 2019: $135,183
– 2024: $175,998
14. Madrid: +30.9%
– 2019: $126,799
– 2024: $165,924
15. Alexandria: +31.2%
– 2019: $58,427
– 2024: $76,677
16. Imperial: +31.4%
– 2019: $157,688
– 2024: $207,237
17. Minden: +31.6%
– 2019: $136,282
– 2024: $179,362
18. Humphrey: +32.0%
– 2019: $246,122
– 2024: $324,879
19. Kenesaw: +32.3%
– 2019: $149,276
– 2024: $197,439
20. Ainsworth: +32.5%
– 2019: $99,120
– 2024: $131,351
21. North Platte: +32.6%
– 2019: $143,693
– 2024: $190,517
22. Beaver Crossing: +32.7%
– 2019: $203,201
– 2024: $269,549
23. Chadron: +33.5%
– 2019: $134,874
– 2024: $180,000
24. Nelson: +33.6%
– 2019: $55,098
– 2024: $73,621
25. Plainview: +33.6%
– 2019: $109,638
– 2024: $146,524
26. Walton: +33.6%
– 2019: $496,456
– 2024: $663,489
27. Oakdale: +33.8%
– 2019: $62,643
– 2024: $83,823
28. Randolph: +34.0%
– 2019: $101,199
– 2024: $135,646
29. Hartington: +34.2%
– 2019: $176,077
– 2024: $236,211
30. Wakefield: +34.3%
– 2019: $137,848
– 2024: $185,178
31. Indianola: +34.7%
– 2019: $117,076
– 2024: $157,666
32. Atkinson: +34.8%
– 2019: $119,056
– 2024: $160,458
33. Crawford: +34.9%
– 2019: $89,261
– 2024: $120,428
34. Gothenburg: +35.2%
– 2019: $134,539
– 2024: $181,848
35. Kearney: +35.2%
– 2019: $218,282
– 2024: $295,190
36. Table Rock: +35.3%
– 2019: $88,726
– 2024: $120,021
37. Sutherland: +35.4%
– 2019: $154,631
– 2024: $209,408
38. Wymore: +35.6%
– 2019: $71,580
– 2024: $97,032
39. Gibbon: +35.6%
– 2019: $185,428
– 2024: $251,441
40. Emerson: +35.7%
– 2019: $126,339
– 2024: $171,415
41. Valentine: +35.8%
– 2019: $160,557
– 2024: $217,977
42. Phillips: +35.9%
– 2019: $224,747
– 2024: $305,422
43. Litchfield: +36.1%
– 2019: $126,205
– 2024: $171,770
44. Coleridge: +36.3%
– 2019: $98,809
– 2024: $134,702
45. Wolbach: +36.4%
– 2019: $107,007
– 2024: $145,999
46. Endicott: +36.5%
– 2019: $93,414
– 2024: $127,549
47. Norfolk: +36.7%
– 2019: $175,197
– 2024: $239,454
48. Weeping Water: +37.0%
– 2019: $157,669
– 2024: $215,984
49. Roca: +37.0%
– 2019: $428,107
– 2024: $586,520
50. McCook: +37.0%
– 2019: $124,935
– 2024: $171,190
51. Hickman: +37.1%
– 2019: $265,218
– 2024: $363,591
52. Bridgeport: +37.3%
– 2019: $101,113
– 2024: $138,821
53. Morse Bluff: +37.5%
– 2019: $261,242
– 2024: $359,200
54. Peru: +37.7%
– 2019: $93,765
– 2024: $129,137
55. Gretna: +37.8%
– 2019: $304,044
– 2024: $419,069
56. Verdon: +37.9%
– 2019: $68,897
– 2024: $94,991
57. Hadar: +38.0%
– 2019: $162,502
– 2024: $224,247
58. Seward: +38.0%
– 2019: $203,900
– 2024: $281,425
59. Pender: +38.0%
– 2019: $146,732
– 2024: $202,547
60. Winside: +38.1%
– 2019: $138,706
– 2024: $191,506
61. Tilden: +38.3%
– 2019: $136,447
– 2024: $188,666
62. Juniata: +38.3%
– 2019: $213,095
– 2024: $294,656
63. Eustis: +38.4%
– 2019: $159,474
– 2024: $220,756
64. Dix: +38.4%
– 2019: $98,320
– 2024: $136,123
65. Elgin: +38.5%
– 2019: $150,056
– 2024: $207,813
66. Staplehurst: +38.5%
– 2019: $174,610
– 2024: $241,896
67. Alliance: +38.6%
– 2019: $120,924
– 2024: $167,624
68. Gering: +38.8%
– 2019: $139,254
– 2024: $193,243
69. Marquette: +38.8%
– 2019: $240,072
– 2024: $333,224
70. Brady: +38.9%
– 2019: $233,720
– 2024: $324,697
71. Scottsbluff: +39.0%
– 2019: $122,215
– 2024: $169,841
72. Bennington: +39.0%
– 2019: $288,308
– 2024: $400,878
73. Dakota City: +39.1%
– 2019: $161,833
– 2024: $225,069
74. Battle Creek: +39.2%
– 2019: $178,712
– 2024: $248,828
75. Papillion: +39.3%
– 2019: $279,350
– 2024: $389,018
76. York: +39.3%
– 2019: $145,841
– 2024: $203,168
77. Meadow Grove: +39.4%
– 2019: $226,395
– 2024: $315,571
78. Doniphan: +39.7%
– 2019: $233,147
– 2024: $325,720
79. Elm Creek: +39.8%
– 2019: $187,239
– 2024: $261,667
80. Rushville: +39.9%
– 2019: $79,542
– 2024: $111,278
81. Hastings: +40.0%
– 2019: $132,915
– 2024: $186,041
82. Ashland: +40.1%
– 2019: $259,307
– 2024: $363,277
83. Fullerton: +40.4%
– 2019: $106,412
– 2024: $149,415
84. Laurel: +40.4%
– 2019: $137,446
– 2024: $193,033
85. Louisville: +40.7%
– 2019: $231,747
– 2024: $326,043
86. Franklin: +40.8%
– 2019: $80,910
– 2024: $113,910
87. Petersburg: +40.8%
– 2019: $209,982
– 2024: $295,756
88. Ravenna: +40.9%
– 2019: $135,576
– 2024: $190,975
89. Creighton: +40.9%
– 2019: $70,613
– 2024: $99,503
90. Valparaiso: +40.9%
– 2019: $276,763
– 2024: $390,062
91. Daykin: +40.9%
– 2019: $128,909
– 2024: $181,693
92. Roseland: +41.2%
– 2019: $161,230
– 2024: $227,722
93. Maxwell: +41.3%
– 2019: $151,537
– 2024: $214,071
94. Milford: +41.3%
– 2019: $204,987
– 2024: $289,630
95. Lincoln: +41.4%
– 2019: $192,875
– 2024: $272,689
96. Eagle: +41.5%
– 2019: $243,635
– 2024: $344,698
97. Waverly: +41.8%
– 2019: $227,952
– 2024: $323,201
98. Bartley: +41.9%
– 2019: $110,325
– 2024: $156,521
99. Saint Paul: +41.9%
– 2019: $138,698
– 2024: $196,859
100. Brunswick: +42.0%
– 2019: $172,337
– 2024: $244,739
101. Madison: +42.1%
– 2019: $132,379
– 2024: $188,140
102. Albion: +42.1%
– 2019: $188,830
– 2024: $268,394
103. Spalding: +42.3%
– 2019: $163,335
– 2024: $232,442
104. Jackson: +42.3%
– 2019: $216,569
– 2024: $308,273
105. Hallam: +42.4%
– 2019: $290,878
– 2024: $414,295
106. Blair: +42.7%
– 2019: $232,075
– 2024: $331,209
107. Bayard: +42.8%
– 2019: $100,998
– 2024: $144,185
108. Columbus: +43.0%
– 2019: $181,906
– 2024: $260,077
109. Plattsmouth: +43.0%
– 2019: $197,150
– 2024: $281,999
110. Shelton: +43.1%
– 2019: $150,788
– 2024: $215,842
111. Ceresco: +43.5%
– 2019: $234,891
– 2024: $337,035
112. Lexington: +43.5%
– 2019: $131,654
– 2024: $188,907
113. Elwood: +43.8%
– 2019: $260,295
– 2024: $374,284
114. Cedar Creek: +43.9%
– 2019: $229,588
– 2024: $330,337
115. Yutan: +44.0%
– 2019: $233,870
– 2024: $336,829
116. Shickley: +44.2%
– 2019: $95,159
– 2024: $137,252
117. Bee: +44.4%
– 2019: $198,345
– 2024: $286,393
118. Genoa: +44.4%
– 2019: $130,350
– 2024: $188,225
119. Johnson: +44.4%
– 2019: $142,559
– 2024: $205,863
120. Glenvil: +44.4%
– 2019: $143,490
– 2024: $207,253
121. Hershey: +44.4%
– 2019: $174,535
– 2024: $252,101
122. Giltner: +44.4%
– 2019: $184,308
– 2024: $266,225
123. Wauneta: +44.5%
– 2019: $85,984
– 2024: $124,214
124. Crofton: +44.6%
– 2019: $169,248
– 2024: $244,765
125. Ruskin: +44.7%
– 2019: $117,457
– 2024: $169,952
126. Ithaca: +44.7%
– 2019: $234,923
– 2024: $339,931
127. Panama: +44.8%
– 2019: $176,264
– 2024: $255,200
128. La Vista: +44.8%
– 2019: $200,275
– 2024: $290,085
129. Davey: +44.8%
– 2019: $321,741
– 2024: $466,024
130. South Sioux City: +44.9%
– 2019: $143,006
– 2024: $207,154
131. Bennet: +44.9%
– 2019: $276,982
– 2024: $401,419
132. Arlington: +45.0%
– 2019: $230,546
– 2024: $334,288
133. Stanton: +45.0%
– 2019: $159,337
– 2024: $231,047
134. Sutton: +45.0%
– 2019: $126,081
– 2024: $182,841
135. Grant: +45.0%
– 2019: $134,343
– 2024: $194,839
136. Grand Island: +45.1%
– 2019: $167,184
– 2024: $242,549
137. Tecumseh: +45.1%
– 2019: $113,340
– 2024: $164,447
138. Pawnee City: +45.3%
– 2019: $73,138
– 2024: $106,239
139. Utica: +45.4%
– 2019: $157,308
– 2024: $228,686
140. Douglas: +45.4%
– 2019: $169,628
– 2024: $246,645
141. Mitchell: +45.5%
– 2019: $132,121
– 2024: $192,204
142. Hampton: +45.5%
– 2019: $178,665
– 2024: $259,958
143. Overton: +45.9%
– 2019: $134,163
– 2024: $195,736
144. Cody: +45.9%
– 2019: $102,778
– 2024: $150,001
145. Central City: +46.0%
– 2019: $132,156
– 2024: $192,916
146. Aurora: +46.0%
– 2019: $165,614
– 2024: $241,826
147. Colon: +46.0%
– 2019: $253,252
– 2024: $369,854
148. Weston: +46.1%
– 2019: $225,141
– 2024: $328,951
149. Duncan: +46.2%
– 2019: $159,245
– 2024: $232,894
150. Burwell: +46.3%
– 2019: $276,172
– 2024: $404,011
151. Cortland: +46.3%
– 2019: $208,208
– 2024: $304,704
152. Orchard: +46.4%
– 2019: $154,263
– 2024: $225,908
153. Elmwood: +46.5%
– 2019: $166,923
– 2024: $244,585
154. Monroe: +46.6%
– 2019: $200,951
– 2024: $294,687
155. Dalton: +46.7%
– 2019: $119,098
– 2024: $174,702
156. Oshkosh: +46.7%
– 2019: $106,565
– 2024: $156,338
157. Fremont: +46.7%
– 2019: $159,264
– 2024: $233,698
158. Dannebrog: +46.8%
– 2019: $178,835
– 2024: $262,501
159. Fort Calhoun: +46.8%
– 2019: $347,222
– 2024: $509,838
160. Saint Edward: +46.9%
– 2019: $126,568
– 2024: $185,937
161. Union: +47.0%
– 2019: $233,116
– 2024: $342,576
162. Morrill: +47.0%
– 2019: $100,375
– 2024: $147,565
163. Upland: +47.0%
– 2019: $106,481
– 2024: $156,546
164. Hoskins: +47.1%
– 2019: $227,191
– 2024: $334,224
165. Wayne: +47.2%
– 2019: $145,773
– 2024: $214,566
166. Byron: +47.3%
– 2019: $97,953
– 2024: $144,291
167. Wahoo: +47.3%
– 2019: $177,111
– 2024: $260,944
168. Omaha: +47.3%
– 2019: $186,857
– 2024: $275,305
169. Bushnell: +47.4%
– 2019: $142,730
– 2024: $210,339
170. Mead: +47.5%
– 2019: $183,356
– 2024: $270,506
171. Raymond: +47.6%
– 2019: $373,825
– 2024: $551,684
172. Auburn: +47.6%
– 2019: $102,265
– 2024: $150,977
173. Elsie: +47.6%
– 2019: $141,440
– 2024: $208,832
174. Murdock: +47.7%
– 2019: $190,937
– 2024: $282,007
175. Verdigre: +47.7%
– 2019: $62,915
– 2024: $92,932
176. Valley: +47.7%
– 2019: $300,552
– 2024: $444,063
177. South Bend: +47.8%
– 2019: $243,599
– 2024: $360,011
178. Osceola: +48.0%
– 2019: $117,105
– 2024: $173,273
179. Otoe: +48.1%
– 2019: $97,759
– 2024: $144,762
180. Springfield: +48.1%
– 2019: $292,927
– 2024: $433,932
181. Osmond: +48.3%
– 2019: $98,302
– 2024: $145,830
182. Chester: +48.4%
– 2019: $60,072
– 2024: $89,160
183. Bellevue: +48.4%
– 2019: $186,530
– 2024: $276,873
184. Lawrence: +48.5%
– 2019: $120,685
– 2024: $179,201
185. Plymouth: +48.6%
– 2019: $124,021
– 2024: $184,238
186. Geneva: +48.7%
– 2019: $105,027
– 2024: $156,147
187. Stella: +48.8%
– 2019: $95,098
– 2024: $141,494
188. Ralston: +48.8%
– 2019: $165,367
– 2024: $246,082
189. Arcadia: +48.9%
– 2019: $165,288
– 2024: $246,083
190. Superior: +48.9%
– 2019: $53,997
– 2024: $80,426
191. Shelby: +49.0%
– 2019: $126,710
– 2024: $188,809
192. Pierce: +49.1%
– 2019: $182,978
– 2024: $272,740
193. Carroll: +49.1%
– 2019: $154,417
– 2024: $230,226
194. Cedar Bluffs: +49.2%
– 2019: $162,380
– 2024: $242,286
195. Nehawka: +49.3%
– 2019: $150,087
– 2024: $224,011
196. Du Bois: +49.3%
– 2019: $116,104
– 2024: $173,311
197. Denton: +49.3%
– 2019: $393,594
– 2024: $587,612
198. Garland: +49.3%
– 2019: $290,741
– 2024: $434,191
199. Homer: +49.4%
– 2019: $120,365
– 2024: $179,822
200. Clearwater: +49.4%
– 2019: $153,342
– 2024: $229,161
201. Henderson: +49.5%
– 2019: $126,591
– 2024: $189,201
202. Curtis: +49.6%
– 2019: $89,099
– 2024: $133,315
203. Trumbull: +49.7%
– 2019: $168,348
– 2024: $251,945
204. Cairo: +49.7%
– 2019: $179,212
– 2024: $268,328
205. Hordville: +50.0%
– 2019: $170,313
– 2024: $255,401
206. Firth: +50.2%
– 2019: $299,296
– 2024: $449,406
207. Lodgepole: +50.2%
– 2019: $103,411
– 2024: $155,368
208. Ames: +50.2%
– 2019: $200,627
– 2024: $301,432
209. Milligan: +50.3%
– 2019: $94,459
– 2024: $142,003
210. Alda: +50.3%
– 2019: $149,099
– 2024: $224,168
211. Prague: +50.5%
– 2019: $180,048
– 2024: $270,937
212. Kennard: +50.7%
– 2019: $272,278
– 2024: $410,190
213. Brule: +50.7%
– 2019: $173,971
– 2024: $262,130
214. Ogallala: +50.7%
– 2019: $132,314
– 2024: $199,402
215. Creston: +51.0%
– 2019: $235,463
– 2024: $355,596
216. Lyman: +51.0%
– 2019: $115,044
– 2024: $173,762
217. Cozad: +51.2%
– 2019: $108,663
– 2024: $164,275
218. David City: +51.3%
– 2019: $119,593
– 2024: $180,957
219. Minatare: +51.4%
– 2019: $138,249
– 2024: $209,243
220. Neligh: +51.4%
– 2019: $102,592
– 2024: $155,279
221. Pickrell: +51.7%
– 2019: $212,129
– 2024: $321,765
222. Murray: +51.7%
– 2019: $161,153
– 2024: $244,511
223. Pilger: +51.8%
– 2019: $190,168
– 2024: $288,613
224. West Point: +52.2%
– 2019: $159,369
– 2024: $242,533
225. Pleasant Dale: +52.3%
– 2019: $317,023
– 2024: $482,797
226. Waterloo: +52.3%
– 2019: $288,245
– 2024: $439,027
227. Lewellen: +52.5%
– 2019: $151,244
– 2024: $230,601
228. Palmyra: +52.7%
– 2019: $213,949
– 2024: $326,631
229. Bancroft: +52.7%
– 2019: $79,392
– 2024: $121,212
230. Maywood: +52.8%
– 2019: $78,685
– 2024: $120,210
231. Alvo: +52.8%
– 2019: $180,719
– 2024: $276,127
232. Alma: +52.8%
– 2019: $113,609
– 2024: $173,589
233. Beatrice: +52.9%
– 2019: $112,736
– 2024: $172,413
234. Saint Libory: +52.9%
– 2019: $218,632
– 2024: $334,388
235. Beemer: +53.0%
– 2019: $117,769
– 2024: $180,212
236. Farwell: +53.1%
– 2019: $172,517
– 2024: $264,072
237. Talmage: +53.2%
– 2019: $105,740
– 2024: $161,944
238. Lindsay: +53.2%
– 2019: $217,445
– 2024: $333,024
239. Dwight: +53.2%
– 2019: $142,705
– 2024: $218,668
240. Chappell: +53.4%
– 2019: $100,846
– 2024: $154,660
241. Fairfield: +53.5%
– 2019: $89,923
– 2024: $138,005
242. Culbertson: +53.5%
– 2019: $108,575
– 2024: $166,642
243. Steinauer: +53.7%
– 2019: $145,617
– 2024: $223,766
244. North Bend: +53.7%
– 2019: $166,407
– 2024: $255,822
245. Nickerson: +53.8%
– 2019: $226,872
– 2024: $348,896
246. Grafton: +53.8%
– 2019: $109,440
– 2024: $168,366
247. Paxton: +53.9%
– 2019: $155,039
– 2024: $238,635
248. Silver Creek: +54.0%
– 2019: $133,633
– 2024: $205,825
249. Syracuse: +54.1%
– 2019: $159,269
– 2024: $245,402
250. Blue Hill: +54.1%
– 2019: $132,630
– 2024: $204,383
251. Shubert: +54.2%
– 2019: $78,438
– 2024: $120,944
252. Dawson: +54.3%
– 2019: $114,120
– 2024: $176,053
253. Martell: +54.3%
– 2019: $342,207
– 2024: $528,169
254. Wisner: +54.4%
– 2019: $130,690
– 2024: $201,788
255. Loup City: +54.5%
– 2019: $99,692
– 2024: $154,005
256. Ord: +54.6%
– 2019: $110,687
– 2024: $171,169
257. Adams: +54.7%
– 2019: $249,391
– 2024: $385,699
258. Whitney: +54.7%
– 2019: $185,220
– 2024: $286,500
259. Hubbard: +54.9%
– 2019: $192,689
– 2024: $298,401
260. Exeter: +54.9%
– 2019: $96,371
– 2024: $149,281
261. Bloomfield: +54.9%
– 2019: $67,757
– 2024: $104,988
262. Friend: +55.0%
– 2019: $133,935
– 2024: $207,582
263. Odell: +55.1%
– 2019: $148,746
– 2024: $230,758
264. Sidney: +55.3%
– 2019: $99,632
– 2024: $154,761
265. Potter: +55.3%
– 2019: $130,102
– 2024: $202,105
266. Rising City: +55.4%
– 2019: $139,534
– 2024: $216,849
267. Bruno: +55.4%
– 2019: $129,689
– 2024: $201,593
268. Stromsburg: +55.6%
– 2019: $117,203
– 2024: $182,324
269. Crete: +55.6%
– 2019: $146,971
– 2024: $228,679
270. Nebraska City: +55.6%
– 2019: $121,645
– 2024: $189,288
271. Platte Center: +55.6%
– 2019: $144,060
– 2024: $224,209
272. Hebron: +55.8%
– 2019: $97,951
– 2024: $152,568
273. Greenwood: +56.0%
– 2019: $179,218
– 2024: $279,545
274. Dorchester: +56.0%
– 2019: $137,161
– 2024: $213,957
275. Ulysses: +56.1%
– 2019: $118,092
– 2024: $184,317
276. Avoca: +56.3%
– 2019: $136,998
– 2024: $214,098
277. Dodge: +56.5%
– 2019: $148,605
– 2024: $232,561
278. Hooper: +56.6%
– 2019: $166,117
– 2024: $260,153
279. Deweese: +56.7%
– 2019: $196,621
– 2024: $308,078
280. Hay Springs: +56.7%
– 2019: $90,570
– 2024: $141,959
281. Bellwood: +56.8%
– 2019: $149,077
– 2024: $233,795
282. Unadilla: +56.9%
– 2019: $167,378
– 2024: $262,552
283. Malcolm: +56.9%
– 2019: $325,435
– 2024: $510,709
284. Diller: +57.0%
– 2019: $133,579
– 2024: $209,689
285. Chapman: +57.2%
– 2019: $182,887
– 2024: $287,533
286. Clay Center: +57.2%
– 2019: $111,599
– 2024: $175,456
287. Fairmont: +57.3%
– 2019: $102,841
– 2024: $161,721
288. Brainard: +57.7%
– 2019: $158,279
– 2024: $249,558
289. Schuyler: +57.9%
– 2019: $129,761
– 2024: $204,943
290. Kimball: +58.1%
– 2019: $93,948
– 2024: $148,542
291. Palmer: +58.3%
– 2019: $187,099
– 2024: $296,134
292. Leigh: +58.7%
– 2019: $160,252
– 2024: $254,303
293. Ashton: +59.3%
– 2019: $65,140
– 2024: $103,737
294. Malmo: +59.4%
– 2019: $272,013
– 2024: $433,694
295. Gordon: +59.7%
– 2019: $56,435
– 2024: $90,117
296. Gurley: +59.8%
– 2019: $93,885
– 2024: $149,985
297. Herman: +60.1%
– 2019: $250,241
– 2024: $400,523
298. Dunbar: +60.1%
– 2019: $159,604
– 2024: $255,525
299. Big Springs: +60.2%
– 2019: $105,567
– 2024: $169,100
300. Mullen: +61.1%
– 2019: $78,877
– 2024: $127,032
301. Hildreth: +61.1%
– 2019: $100,820
– 2024: $162,457
302. Clarks: +62.4%
– 2019: $185,443
– 2024: $301,079
303. Linwood: +62.4%
– 2019: $213,289
– 2024: $346,360
304. Wilber: +62.7%
– 2019: $126,834
– 2024: $206,303
305. Carleton: +62.8%
– 2019: $122,272
– 2024: $199,097
306. Campbell: +62.8%
– 2019: $64,613
– 2024: $105,220
307. Bruning: +63.2%
– 2019: $88,002
– 2024: $143,643
308. Tekamah: +63.3%
– 2019: $112,806
– 2024: $184,193
This completes the list. Thanks for reading.


